Eclipse PDT: Integrating Apache Bench for load testing
When I use an IDE, I expect for it to do everything I need for my project, from start to finish. As you may have read in earlier entries, I enjoy using Eclipse PDT. I think its time to include load testing into my arsenal of tools inside of eclipse. I’m going to focus on apache’s AB for this article.
ab - a quick summary of some of the features
ab is a pretty versatile tool for load testing that comes with the standard apache http webserver install. In order to get the best usage out of this tool, you should read up on the online manual. However, we’re going to cover a few of the features that are part of this demonstration here.
-c Concurrency
Number of requests to perform at one time. This defaults to 1. I tend to bump this up a bit in order to simulate a high traffic period.
-k Keep Alive
Enable the HTTP keepAlive feature. Default is no keep alive. To do standard testing, you will want to keep this disabled.
-n Number of Requests
The number of requests to do during this session. Default is 1, so you PROBABLY want to create a higher number here. Remember that the number of requests will be split across your concurrency setting.
-t timelimit
Instead of specifying a -n amount (with this option, it actually says ‘50,000’ requests), you can specify an amount of time to test the requests.
Well, there you have it. Just the few top options that you need. Now, let’s look into eclipse.
Eclipse PDT - Add an External Tool
In order to accomplish this task, we’re going to have to create an external tool in Eclipse. Remember, the output of the external tools gets routed to the console in eclipse, so its still all encapsulated in the IDE.
First, Open External Tools Dialog
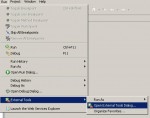
After starting Eclipse PDT: Click the Run menu, select the External Tools menu option and click the External Tools Dialog… option.
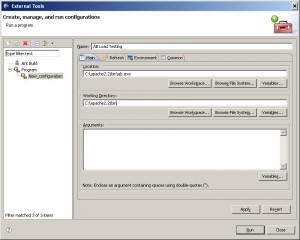
Configure the Program call External Tools
Double click the Program Menu item. This new screen will bring up the external tools menu items. So far, I’ve named my External Tool ‘AB Load Testing’ and filled in the path to my ab.exe and working directory.
Configuring the command line arguments
For this setup, I’m going to stick with concurrency and with number of requests. You may want to swap out the -n option with the -t.
Add in the -c argument.
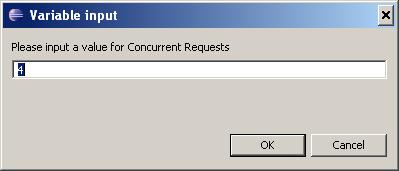
You’ll notice that you have the option to click on variables. Eclipse has the ability to prompt for variables, so we’ll set these settings interactively. (You may find that you will end up creating some standard tests that do not require prompting, but for this exercise we’re going to make it very interactive.)
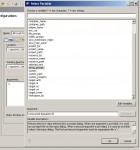
Click the Variables button.
Scroll down until you see string_prompt and select it. You’ll notice that the arguments that you can specify are the prompt text and the default value. Fill in your prompt text and default value separated by a colon in the arguments box.
Repeat the process with the -n option. I selected -n ${string_prompt:Number of requests?:40}.
Finally, create the prompt for the URL to test. (Remember, like I said, you might end up creating these more scripted by hard-setting these values in the future.) I selected ${string_prompt:URL to test?}.
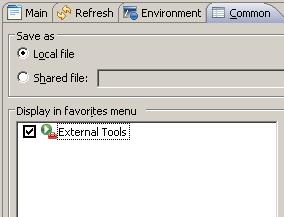
Click the Common tab, check external tools under the favorites menu.
Click Apply, Click Close. This saves your external program.
Running your External Program the First Time
Click the external tools drop down and select AB Load Testing.
You should start to receive your prompts. Fill in the items as appropriate.
And, as you can see, after it is completed, you will see the output in the console.
For example, my output was this:
This is ApacheBench, Version 2.0.40-dev <$Revision: 1.146 $> apache-2.0
Copyright 1996 Adam Twiss, Zeus Technology Ltd, http://www.zeustech.net/
Copyright 2006 The Apache Software Foundation, http://www.apache.org/

Benchmarking localhost (be patient).....done


Server Software:        Apache/2.2.3
Server Hostname:        localhost
Server Port:            80

Document Path:          /loadtest.php
Document Length:        3 bytes

Concurrency Level:      4
Time taken for tests:   6.62500 seconds
Complete requests:      40
Failed requests:        0
Write errors:           0
Total transferred:      7480 bytes
HTML transferred:       120 bytes
Requests per second:    6.60 [#/sec] (mean)
Time per request:       606.250 [ms] (mean)
Time per request:       151.563 [ms] (mean, across all concurrent requests)
Transfer rate:          1.15 [Kbytes/sec] received

Connection Times (ms)
              min  mean[+/-sd] median   max
Connect:        0    0   0.0      0       0
Processing:   109  560 315.0    609    1000
Waiting:      109  560 315.0    609    1000
Total:        109  560 315.0    609    1000

Percentage of the requests served within a certain time (ms)
  50%    609
  66%    703
  75%    812
  80%    906
  90%   1000
  95%   1000
  98%   1000
  99%   1000
 100%   1000 (longest request)
Do you have any other cool ways of customizing this external tool?
