XDebug and Eclipse PDT on Windows - From Start to Finish
XDebug and Eclipse PDT on Windows - From Start to Finish
With our recent upgrade to php at “the triangle,” I felt it was time to start working on using a debugging and code profiling tool. When I say felt like it was time… I meant our PHP version finally supported it. sigh. Anyway, from start to finish, this is what I did in order to get Xdebug to integrate into my current eclipse PDT - as well as investigate the other features of xdebug. I tried to detail all of the mistakes I made as well as what I figured out. Let’s go:
Get XDebug
I went to xdebug.org and acquired my version of the debugger dll for windows. I’m using Windows XP, Apache 2.2.8 and PHP 5.2.5 for this article. The Xdebug I downloaded was XDebug 2.03 Against PHP 5.2.5. (I thought about getting the binary snapshot of 2.1dev… but finally decided against it - smartly.)
I modified my php.ini file to load in the extension file. On windows, this is a TS type - or thread safe. Also remember, this is a zend extension, not a normal extension. At the end of my php.ini file, I started with this:
;Xdebug stuff
zend_extension_ts="c:\php\ext\php_xdebug-2.0.3-5.2.5.dll"
xdebug.default_enable = on
Ok - good to go - restarted apache and everything worked fine.
Just for fun, jump out and do a phpinfo(). You should find the following lines:
This program makes use of the Zend Scripting Language Engine:
Zend Engine v2.2.0, Copyright (c) 1998-2007 Zend Technologies
    Xdebug v2.0.2, Copyright (c) 2002-2007, by Derick Rethans
Additionally, in the modules section, xdebug will be listed. This will show all of the standard debugger options - some of which we’ll be discussing further down in this article.
var_dump() - the first xdebug feature
Supposedly, when you install xdebug, it pretties up the output of var_dump.
My first test script was to see if xdebug was really doing what it claimed:
$arrayName = range(0,5);
var_dump($arrayName);
Loaded it up - and … no. It looked exactly the same as it did before. Nothing special.
After looking around in my php.ini, I noticed one thing that I had changed from the default setting. I normally turn off html errors because I don’t have the manual installed or click through to a web manual. Well, I had it turned off now. I enabled it with this setting in my php.ini file
html_errors = On
Now, the var_dump() looks great:
**array**
  0 => int 0
  1 => int 1
  2 => int 2
  3 => int 3
  4 => int 4
  5 => int 5
OOOh and Errors are Pretty
Another feature of the module is to beautify your error messages - well not just beautify them but add extra information to them.
By default, when you generate an error in your php with xdebug installed, you’ll see a call stack as well as the error message.
I used the following code:
print $a;
which prompted this error:
<table cellpadding="1" cellspacing="0" border="1" dir="ltr" >
<tr >( ! ) Notice: Undefined variable: a in C:\code\default\htdocs\test.php on line _2_</tr>
<tr >Call Stack</tr>
<tr >#TimeMemoryFunctionLocation</tr>
<tr >
<td style="background-color: #eeeeec" align="center" >1
</td>
<td style="background-color: #eeeeec" align="center" >0.0005
</td>
<td style="background-color: #eeeeec" align="right" >49328
</td>
<td style="background-color: #eeeeec" >{main}(  )
</td>
<td style="background-color: #eeeeec" title="C:\code\default\htdocs\test.php" >..\test.php**:**0
</td></tr>

</table>
Looks pretty cool. Xdebug has the ability to show extra variables, including the super globals, in this dump. For the most part, however, I’m only interested in my local scope variables - I don’t need to know what $_SERVER['HOST_NAME'] is if I have an undefined variable. I added this setting to my php.ini:
xdebug.show_local_vars = 1
I then used this code for testing:
$b = 'test';
if ($b) {
  print $a;
}
After executing it, I got this error:
<table cellpadding="1" cellspacing="0" border="1" dir="ltr" >
<tr >( ! ) Notice: Undefined variable: a in C:\code\default\htdocs\test.php on line _5_</tr>
<tr >Call Stack</tr>
<tr >#TimeMemoryFunctionLocation</tr>
<tr >
<td style="background-color: #eeeeec" align="center" >1
</td>
<td style="background-color: #eeeeec" align="center" >0.0010
</td>
<td style="background-color: #eeeeec" align="right" >49864
</td>
<td style="background-color: #eeeeec" >{main}(  )
</td>
<td style="background-color: #eeeeec" title="C:\code\default\htdocs\test.php" >..\test.php**:**0
</td></tr>

<tr >Variables in local scope (#1)</tr>
<tr >
<td style="background-color: #eeeeec" >$a
</td>
<td colspan="2" style="background-color: #eeeeec" >_Undefined_
</td></tr>
<tr >
<td colspan="2" align="right" style="background-color: #eeeeec" valign="top" >

    $b =

</td>
<td colspan="4" style="background-color: #eeeeec" >

    <small>string</small> <font color="#cc0000">'test'</font> <i>(length=4)</i>


</td></tr>
</table>
As you can see, this is helpful to me to know that $b had a value - and that we were in the if statement because of $b’s value.
There are more settings for xdebug’s error dumping routine - check them out at the variable display pages at xdebug.org.
Tracing isn’t just for tattoo artists anymore
The next thing I wanted to set up was Xdebug’s stack trace feature. This will give useful information about which functions were called, how many times, and their memory usage. Xdebug integrates additional commands into the php script to start and stop tracing whenever needed. However, if you use auto_prepend files, you may want to turn on tracing immediately/automatically. I added the following settings to my php.ini:
xdebug.auto_trace = 1
xdebug.collect_return = 1
xdebug.trace_output_dir = c:/tmp
xdebug.trace_output_name = trace.%H
The first line turns on tracing on every script (this is also useful because at “the triangle” we use some PHP scripts to serve CSS), the next one collects return results from functions into the trace (on larger functions/projects, this might be slow…) and the third one adds where we want to put the script. The last setting is to name the actual trace file. In this case, I’m using the Host name. There are additional naming cards available - check out the documentation for these. I found hostname to be the most useful - or %R on occasion - which is the REQUEST_URI.
To generate my trace, I used this code:
function tester($element)
{
  return trim($element);
}

$a = ' test ';

$b = tester($a);

print "XX{$b}XX";
This generated this trace:
TRACE START [2008-05-19 17:12:49]
    0.0010      52360   -> {main}() C:\code\default\htdocs\test.php:0
    0.0011      52568     -> tester() C:\code\default\htdocs\test.php:10
    0.0012      52640       -> trim() C:\code\default\htdocs\test.php:5
                             >=> 'test'
                           >=> 'test'
                         >=> 1
    0.0000      14992
TRACE END   [2008-05-19 17:12:49]
As you can tell, simple - but could be useful when you have a larger application to trace through.
Profiling with XDebug
Xdebug allows for code profiling as well. This will be useful to determine which functions are taking longer than others to run - in a way identifying the bottlenecks of your script.
In order to get profiling enabled, I added these settings to my php.ini file.
xdebug.profiler_enable = 1
xdebug.profiler_output_dir = c:/tmp
xdebug.profiler_output_name = cachegrind.out.%H%R
The first setting enables profiling. You can add a setting called xdebug.profile_enable_trigger if you wanted to generate profiles only for selected scripts. I wanted to be able to catch everything, so I left that one out. The profile files will be sent to c:/tmp. Finally, the files will be named cachegrind.out with HTTP_HOST (%H) and REQUEST_URI (%R). For more options on naming, check out the xdebug documentation page for profile file names (these are the same as the trace file output).
I’m going to use the same bit of code and generate a profile:
version: 0.9.6
cmd: C:\code\default\htdocs\test.php
part: 1

events: Time

fl=php:internal
fn=php::trim
5 4

fl=C:\code\default\htdocs\test.php
fn=tester
10 128
cfn=php::trim
calls=1 0 0
5 4

fl=C:\code\default\htdocs\test.php
fn={main}

summary: 267

0 135
cfn=tester
calls=1 0 0
10 132
Not very exciting… so let’s look at our tools for Windows…
WinCacheGrind
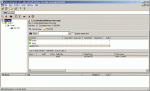
WinCacheGrind is the windows version of the software that can parse these profile files and generate usable statistics. Since development has ceased in 2005, this project isn’t a very likely candidate for doing profiling. You can see from the screenshot that our very simple script generates only a few details - but the actual UI is very limited - with not a lot of features (or maybe kcachegrind has spoiled me)…
KcacheGrind
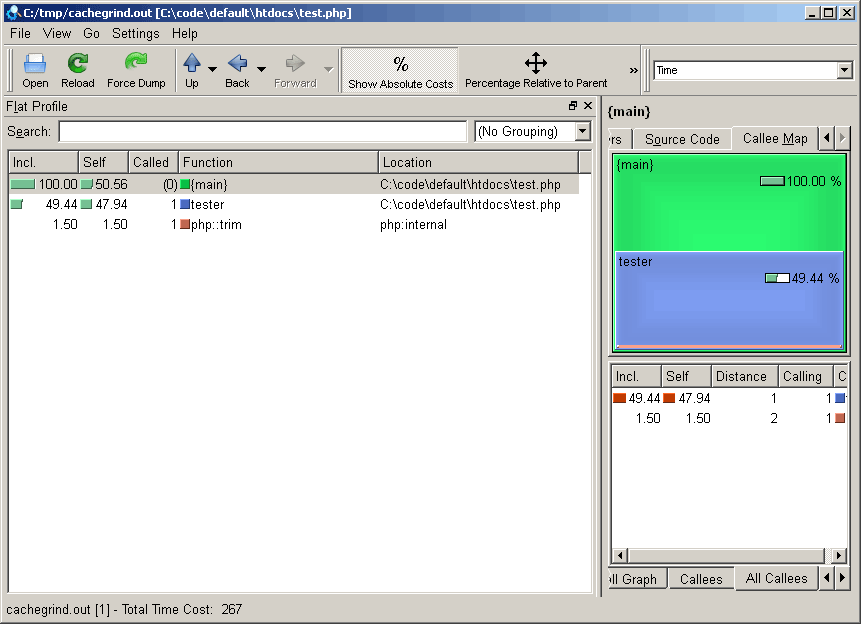
KcacheGrind is a linux based utility in KDE. Since I’m on windows, I had to acquire the KDE4Win. Once installed, I could run any KDE app that had been ported into this release - so I fired up KcacheGrind.
As you can see from the screenshot, there are a lot more features available. I did run into two issues, however. First, every time I loaded a new profile file when I currently had one open, kcachegrind would crash. The other was the lack of the ‘dot’ program from the graphviz package (which hasn’t been ported over to KDE4 yet as far as I know…)
Debugging with PDT - or - why I have two monitors…
First, let’s clarify my expectations of this debugger. The debugger must work with my version of PHP, must at least SHOW me values of items (being able to change them on the fly is better), allow for break points and use firefox (I like my webdeveloper extension… what?).
XDebug promises all of that. Let’s check it out.
XDebug PHP.ini settings
In order to support xdebug’s integration with PDT, its a feature called remote debugging. This is normally handled by a debugging client (which PDT plays). The php.ini file has to be modified to allow for remote debugging, however:
xdebug.remote_enable=On
xdebug.remote_host=localhost
xdebug.remote_port=9000
xdebug.remote_handler="dbgp"
The first line tells the remote debugger to enable. Next, you can specify the host. This can either be a hostname or an IP address. (Yes, I tried putting multiple hostnames… no go!) Next, you can specify the port that the requests will come through on. Finally, the remote handler is the type of protocol the client that you will be using has. Eclipse PDT uses dbgp.
To allow for us to see our output immediately, we must make sure that implicit_flush is on in our php.ini (normally the debugger holds the script ‘hostage’ - and so no debugging gets sent out regularly).
implicit_flush = On
We’re done doing our config - let’s fire up Eclipse.
XDebug Eclipse PDT Settings
First off, make a new project in eclipse. Then, a new PHP file. I’m going to continue using my same code and name it test.php. On my machine http://localhost/test.php will launch this script.

In Eclipse PDT, click the Window menu and choose preferences. Expand the General item and click on Web Browser. Here it probably says use internal web browser. In my experience on Windows, the internal browser is MSIE… and I want to use firefox. Check use external web browser - and make sure there is a check next to default system web browser (mine is FireFox, so I’m good to go. You could also choose the external browser you wanted to use if it is listed here….)
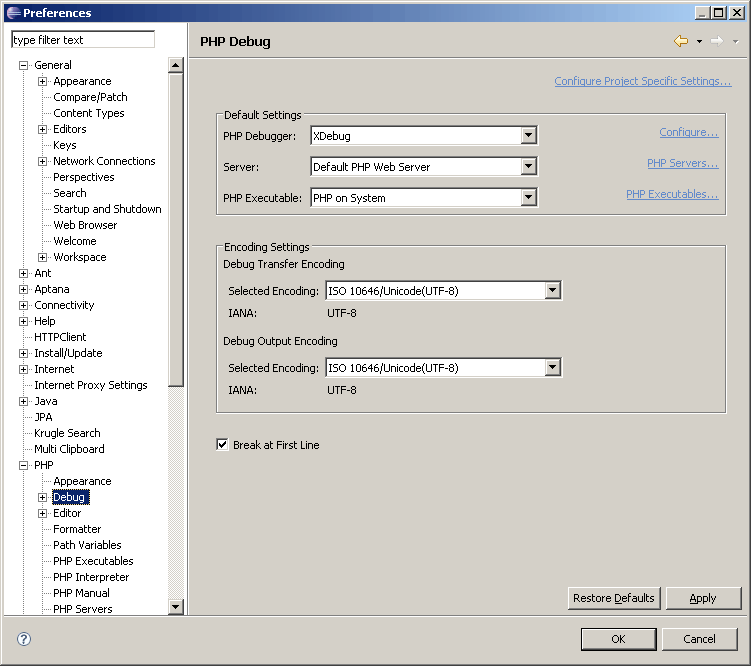
Next, expand the PHP item and click on Debug. For the PHP Debugger, you’ll have to choose ‘Xdebug’ - mine was set to zend debugger. Next, choose the server that will be running the php. I didn’t have one, so I had to click on PHP Servers and add one with http://localhost.
Click OK and you’re good to go with your debugger set up.
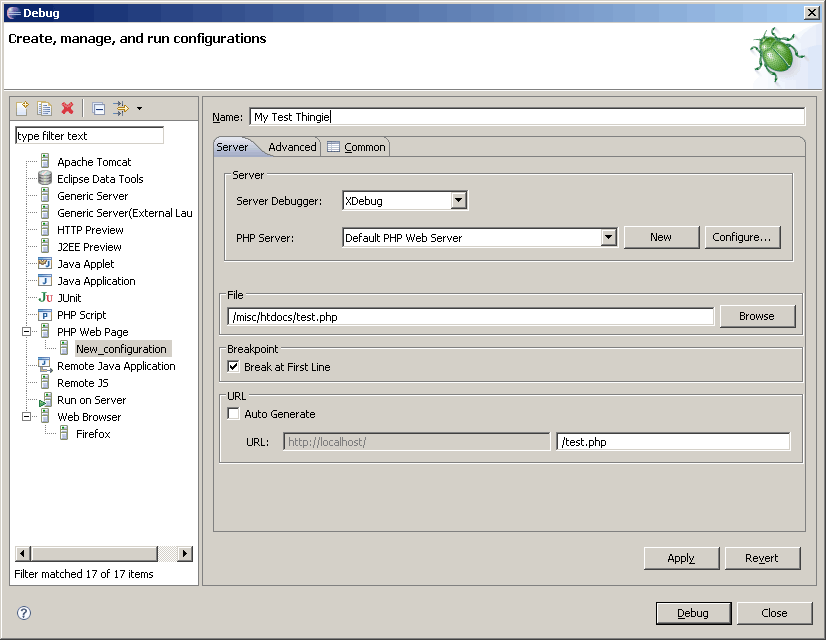
Next, you have to set up a debugging project script. Click the Run Menu and click on ‘open debug dialog’. Double click the PHP web Page option to generate a new_configuration. You could change this to any name you want. You should make sure that XDebug is selected with the proper server. You can click on browse to locate the file you want to start debugging with. Notice, you’ll be browsing through open projects. In my case, I’m choosing test.php. If you had a larger project, you might just start with it’s index.php file. I like to mark ‘break at first line’ just in case I forget to make break points. Finally, uncheck ‘auto generate’ under the URL if the URL isn’t correct. Click Close.
Eclipse will try to open up the PHP Debug perspective when you launch a debugging task. This is ok to do - and probably very helpful. If it prompts for it to open, choose to allow it.
Now, when you’re ready to run your script, click the Run menu and choose ‘debug’. If this doesn’t work, you might have to do it from your debug dialog box once.
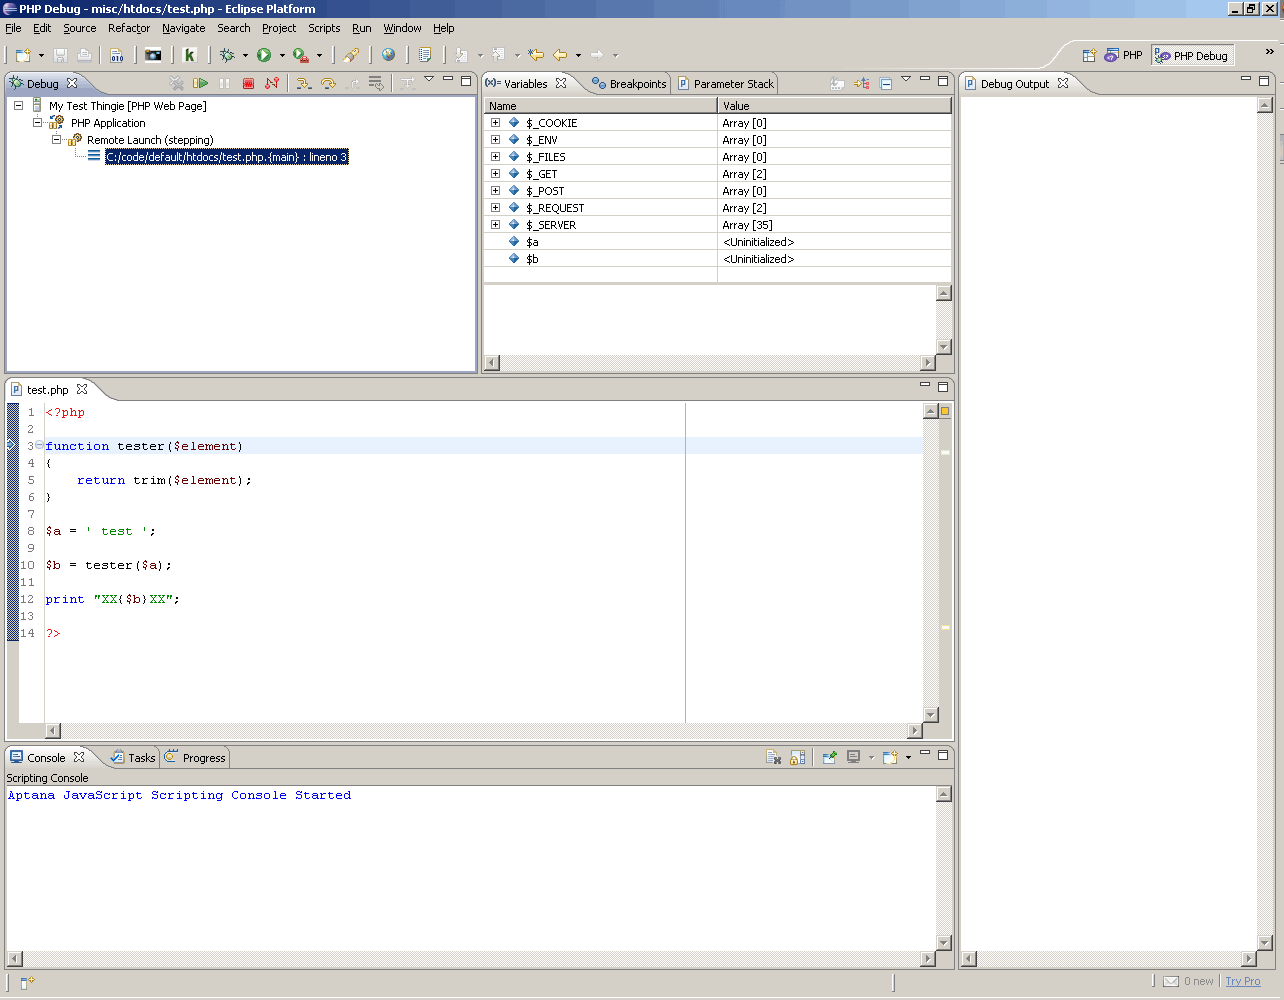
OK - cool - but what am I seeing here?
In my screenshot, I’ve got most of the tabs still available. The debug tab lists what test is being executed and gives debugging controls. There is a variables tab which shows you the values of the variables at any one point. The breakpoints tab will show you what breakpoints you have created (if you haven’t ever done that, just double click next to a line of code - and a breakpoint will be created).
Then you have the debug output tab - which should be like some sort of console output (this was not working with my install), and the actual code.
By choosing one of the yellow arrows in the debug tab, you can step through each line of the code. The code section will highlight the current line you’re on.
Firefox should have opened up with the contents of your script.
So - now I’ve gotta complain
This seems broken to me. I’ve noticed that I do not receive any output to the firefox instance - as well as to the debug output. Matter of fact, when I launch the instance, I get this URL: http://localhost/test.php?XDEBUG_SESSION_START=ECLIPSE_DBGP&KEY;=121121990330716
This looks fine to me - but then it just sits there. I finally have to stop my debug job in eclipse… and two more windows open up with the contents of ‘DEBUG SESSION ENDED’ and an URL of: http://localhost/test.php?XDEBUG_SESSION_STOP_NO_EXEC=ECLIPSE_DBGP&KEY;=121121990330716
I’m never actually able to see any output on my firefox until the script is stopped - and the debugging task never seems to end.
Things I thought about:
-
is implicit flush on in php.ini? yes it is.
-
perhaps the job should never end to support links? Ok - cool - but I should still see output
-
you don’t have zend debugger installed do you? of course not fool!
So… so far, it looks like it has all kinds of cool features up until the point of actual debugging. I’ve tried it with smaller sites, and test scripts and larger sites. I’m not sure what is wrong with it - it might just be me. Time to dig in.
Some Updates From XDebug’s Mailing list
Message 1263 from Xdebug Mailing list states:
I tried to debug in eclipse (Version: 3.3.2) with xdebug 2.0.3.
a problem when debugger runs beyond end of php-page. the browser keeps waiting for a page output (state: waiting for localhost…)
The only way to stop it is to end the debug session.
within version 2.0.2 this works.
Maybe a problem in the (new) DBGp ?
I think it’s a problem with how eclipse handles DBGp. I did indeed change it as it wasn’t following the specs correctly. I cc-ed the mailinglist, as I know there’s some eclipse developers on there.
regards, Derick
and
Message 1250 from Xdebug mailing list states:
My reading of this is that xdebug has an enhanced output when a php error is output which somehow breaks the application. As for PDT being able to get the output from the script. DBGp protocol has a couple of interesting commands stdout,stderr and notifications, and I assume xdebug supports these, so through one of these mechanisms I would hope to be able to capture information.
Another way might be through the registering of exception breakpoints as well.
All of these features were on my list, but I prioritise work the work on PDT based on what is raised on the eclipse bugzilla for PDT, There is a enhancement request to capture output into the PDT output console.
Regards Dave Kelsey
So the debug output and the actual freezing of the firefox seem like known issues…
Let’s try an Older Version - TA DA!!
I found the older version (2.0.2) of the software by modifying the download URL.
I used this version and I don’t see the output until the script has finished - even after it had passed a print statement. Also, the debugger output still goes into the firefox new window - but this time only one time.
My next thought was maybe the output_buffering size was too large - so I made this change to my output buffering setting in my php.ini
output_buffering = Off
After making this change, I was able to see my items on the fly. It even stopped trying to load the page. It still did make a new popup, though.
My last attempt was to use the newer version with my modified php.ini.
Nope - no go. It still keeps running and opens TWO windows.
So what’s the verdict?
XDebug is awesome. Enhanced var_dump() and error messages, built in stack tracing, tracing and profiling, and remote debugging. It is pretty amazing - albeit slightly incompatible with the newest PDT/Xdebug. KcacheGrind is the only way to fly when it comes to viewing cachegrind output files - wincachegrind is useless. Too bad my KDE4Win + kcachegrind keeps dying. All in all, I am keeping xdebug in my setup.